- Home
- Integrations
- Observability Monitoring
Observability Monitoring
To view and filter the records of all deployed integration executions, access the Executions screen:
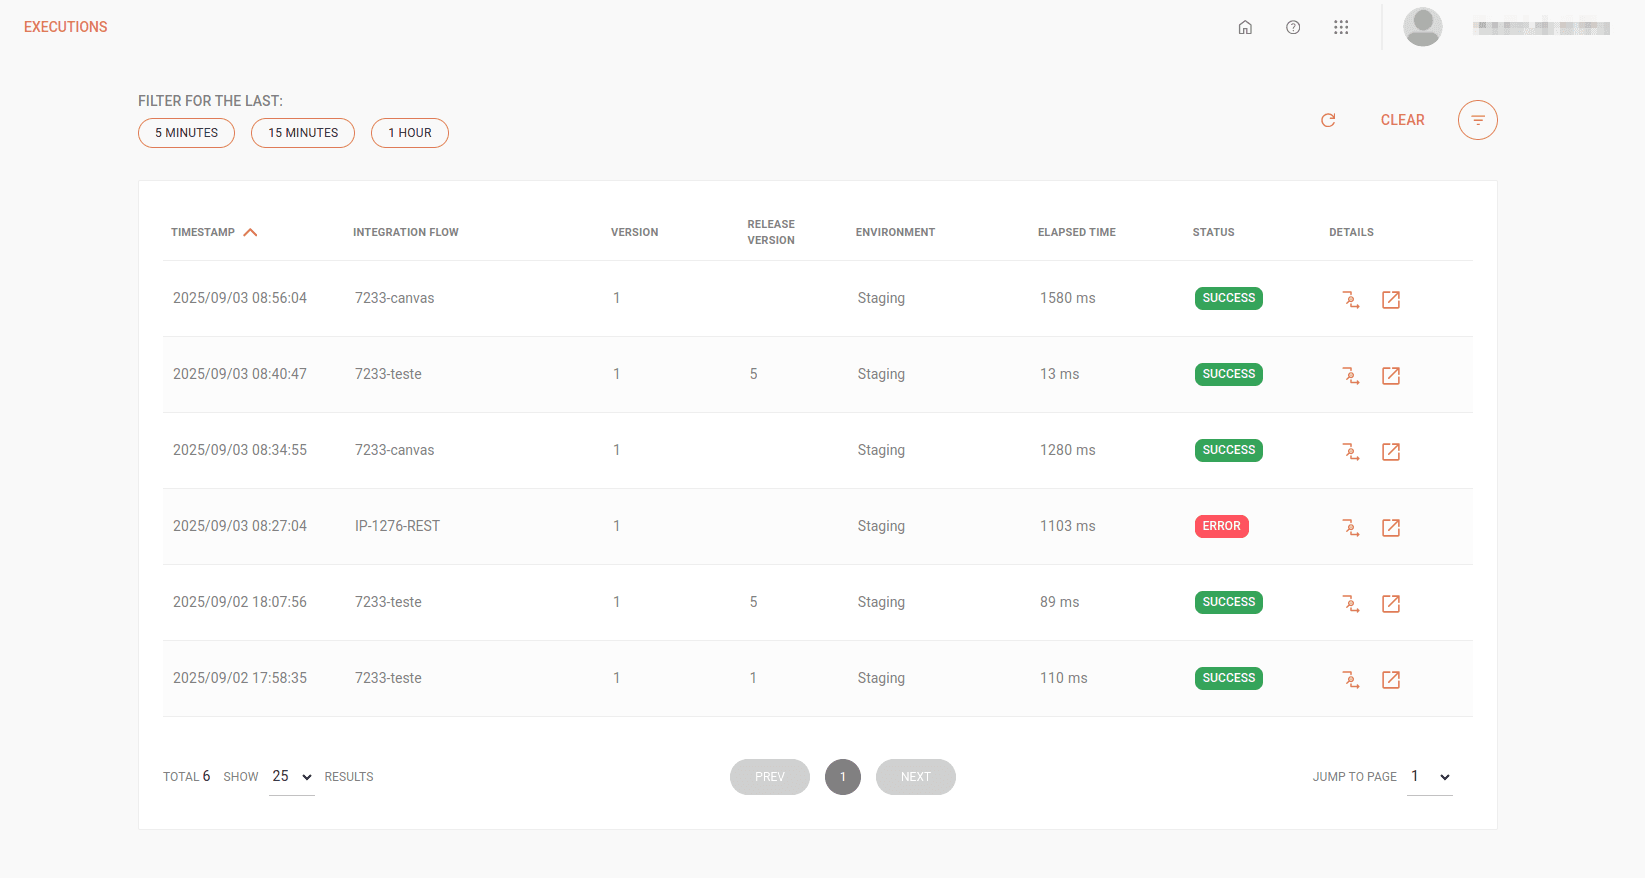
Viewing execution records
The integration executions list contains the following fields:
-
TimeStamp: date and time of the start of execution. The format is year-month-day for the date and hour-minute-second for the time.
-
Integration Flow: name of the integration flow.
-
Version: version of the integration flow.
-
Release Version: version of the release (automatic). If the flow is not associated with a release, this field will be blank.
-
Environment: environment where the integration flow was deployed.
-
Elapsed Time: time, in milliseconds, of the integration flow execution.
-
Status: execution status. Can be success or error.
-
Details: execution details:
-
View Trace: by clicking the
 button, you can view the detailed trace of each step of an integration flow.
With this complete view, it will be possible to monitor process performance, identify bottlenecks, and perform debugging efficiently.
button, you can view the detailed trace of each step of an integration flow.
With this complete view, it will be possible to monitor process performance, identify bottlenecks, and perform debugging efficiently. -
Log Details: By clicking the
 button, you will be directed to Sensedia Analytics, where you can view:
- Request records of the REST type trigger.
- Request and response records of:
- Connectors
- JSON Transformation
- Choice V2
- For Each
-
This way, you can perform detailed analyzes of integration flows and optimize efforts for problem solving.
NOTESee log details.
Filtering execution records
Filter for the last
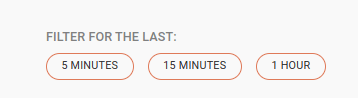
In Filter for the last, (located in the upper left corner of the screen), you filter the results of your integration execution records using the buttons:
- 5 minutes for the last 5 minutes;
- 15 minutes for the last 15 minutes;
- 1 hour for the last hour.
NOTEWhen a filter is applied, the results are not automatically updated after an interval of time. It is necessary to use the
button to reestablish the display of data corresponding to the applied filter.
To clear the result of the used filter, click CLEAR.
Filter
The ![]() button allows for more advanced filtering of your execution records.
button allows for more advanced filtering of your execution records.
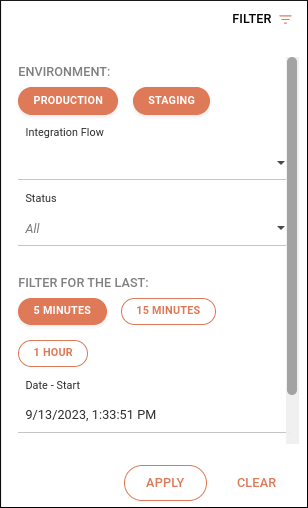
To use it, follow the steps below:
Click ![]() , in the upper right corner of the screen.
, in the upper right corner of the screen.
In Environment, select the environment. It can be Staging, Production, or both.
In Integration Flows, select the integration flow.
In Status, select whether you want to filter by success or error.
In Filter for the last, select the interval you want to check.
You can choose between the last 5 minutes, 15 minutes, or the last hour.
In Date-Start and Date-End, select the period you want to filter. The format is year-month-day for the date and hour-minute-second for the time.
Click APPLY in the lower right corner.
If you want to clear the data already entered in the filtering, click CLEAR
NOTEIf the filtering returns more than 100 thousand records, a message will be displayed requesting the refinement of the search criteria. You can select today or up to 7 days ago, counting date/time.