- Home
- Integrations
- Test Mode
Test Mode
Test mode allows you to execute an integration flow before its deployment to the environment. It offers benefits such as error detection, data validation, and performance optimization, ensuring that the integration works correctly. Additionally, it is possible to test a flow even if it is not yet complete, allowing adjustments and improvements throughout the process.
Requirements for test mode execution:
- All mandatory information in the configuration forms must be filled in;
- The flow must include a trigger step;
- The flow must be saved before test execution;
- All steps must be connected;
- If the flow uses environment variables, the test will be executed with the values defined in the environment variables.
- If the flow you created uses authorizations, you must register the authorization in the Staging environment.
IMPORTANTTest mode should be used for basic validations during flow creation. For tests involving large data volumes, we recommend deploying the flow to a staging environment, when appropriate.
Configuring test mode
Test mode configuration depends on the trigger type you are using. There are two types of triggers:
Next, learn how to configure the execution information for each type.
REST
Click the TEST MODE button in the upper right corner.
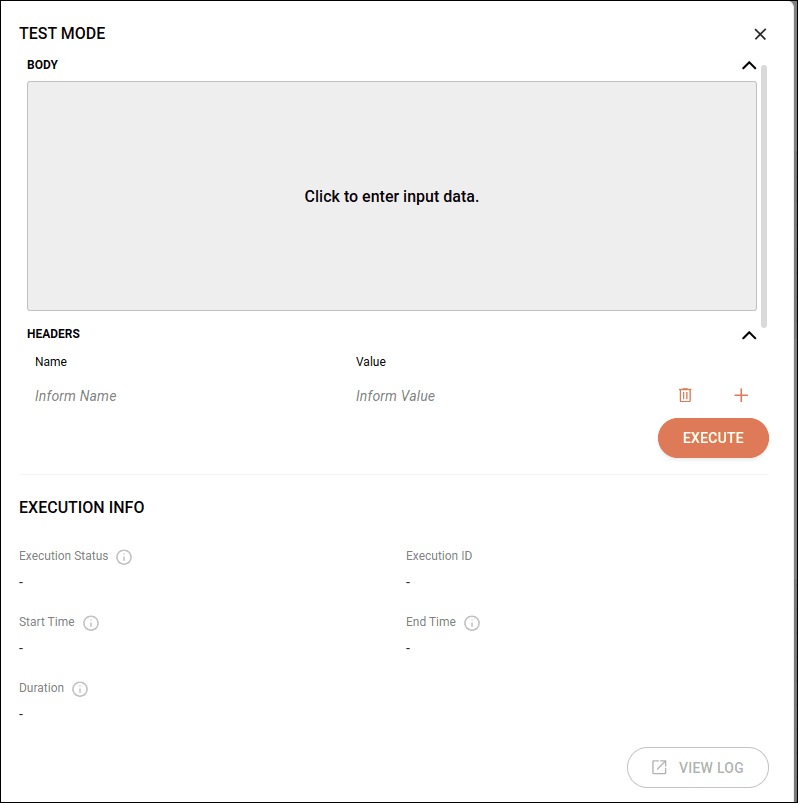
(Optional) On the Test Mode screen, fill in the following fields:
-
Body: insert the payload for execution.
-
Headers
- Name: enter a name for the Header value. Maximum of 40 characters.
- Value: enter the value.
To add new values, click the
 button.
 -
Query Params
- Name: enter a name for the Query Params value.
- Value: enter the value.
To add new values, click the
button.
TIPTo expand or hide field values above, click on the arrow icon
. You can also use scrolling if you want to view all three fields expanded.
The
sign indicates that the fields have been filled in.
Click the EXECUTE button.
Check the execution response right below, in Execution Info.
Scheduler
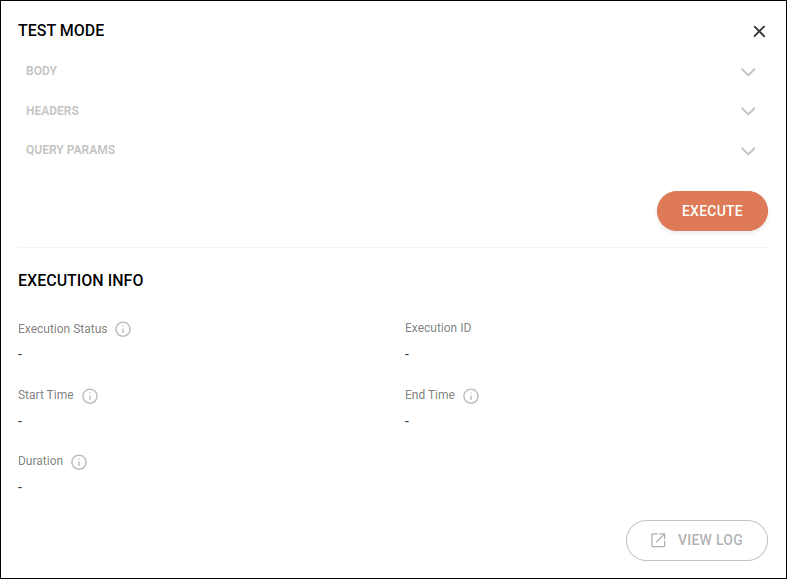
Click the TEST MODE button in the upper right corner.
On the Test Mode screen, the Body, Headers, and Query Params fields are blocked for this trigger.
Click the EXECUTE button.
Check the execution response right below, in Execution Info.
Execution information
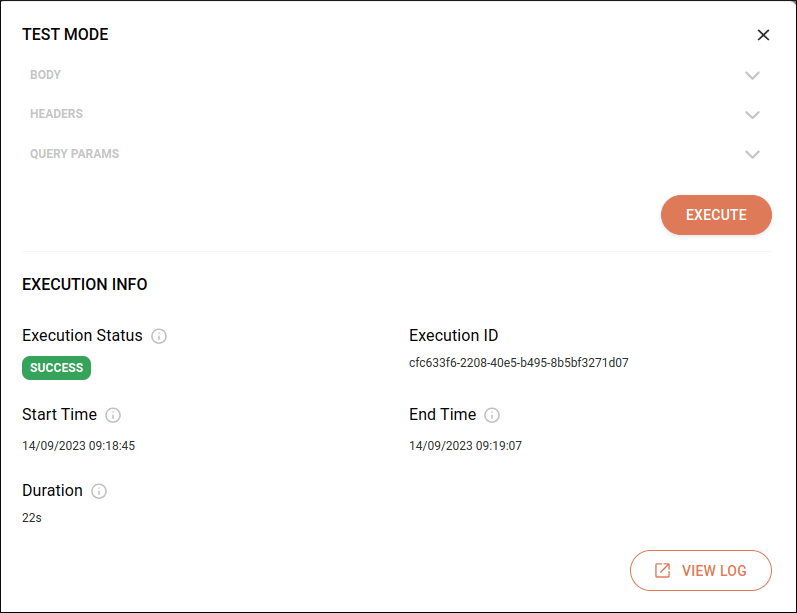
The Execution Info section displays details of the integration flow execution. Here, you can check:
-
Execution Status: the execution status. Can be deploying (executing), success, or error.
-
Execution ID: the execution identification.
-
Start Time: date and time of execution start.
-
End Time: date and time of execution end.
-
Duration: the total test execution time in milliseconds.
-
View Log
 : by clicking this button, you can view detailed execution logs in Sensedia Analytics.
NOTEIntegration execution in test mode does not generate logs on the Executions screen.
TIPBetter understand the format of execution logs displayed in Sensedia Analytics.