- Home
- Flexible Actions
- Triggered Alerts
Triggered Alerts
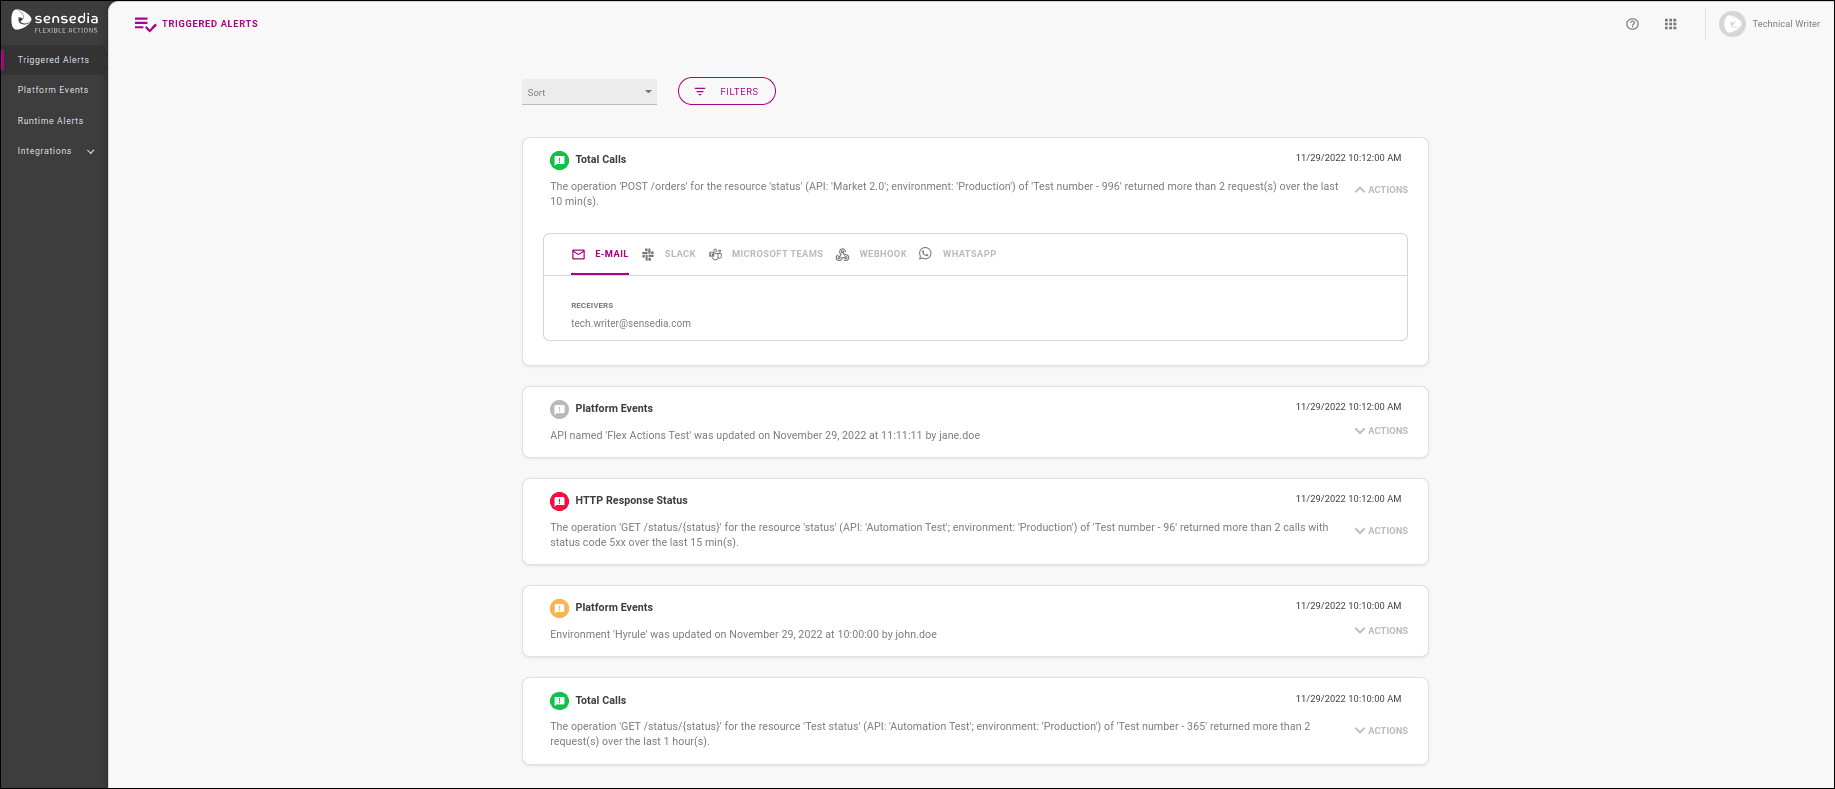
The Triggered Alerts screen displays the list of alerts triggered in the last 60 days.
Filters and sorting
By default, the alert list is sorted chronologically from newest to oldest and covers seven days of data up to the current date. However, you can customize the results to find alerts more easily. Using the Sort field, you can sort the list in ascending or descending order. With the FILTERS button, you can use different optional filters for a customized return:
- The Min. Date and Max. Date fields allow you to select a more specific date and time range than the last seven days.
- The Classification field filters by alert classification (the level of criticality), which can be Neutral, Success, Warning, or Critical.
- The Tags field filters by optional tags added to alerts during their creation or editing to categorize them.
WARNINGThe tags that were active when the alert was triggered are valid for searches on the Triggered Alerts screen. If you have just added a new tag, for example, it will only return search results the next time the edited alert is triggered.
-
The Action Status field filters by success (Success) or error (Error) in the execution of the actions configured for the alert.
-
The Alert Type field filters by alert type: Runtime Alerts or Platform Events.
- If Runtime Alerts is selected, another field, Notification Type, will appear, filtering between the different monitorable API performance parameters (Total Calls, Availability, Latency, and HTTP Response Status).
- If Platform Events is selected, another field, Platform Object, will appear, filtering between the different API Platform objects that can be monitored. Check the available objects here.
Click FILTER to generate a list with the selected filters. To return to the default list, click CLEAR.
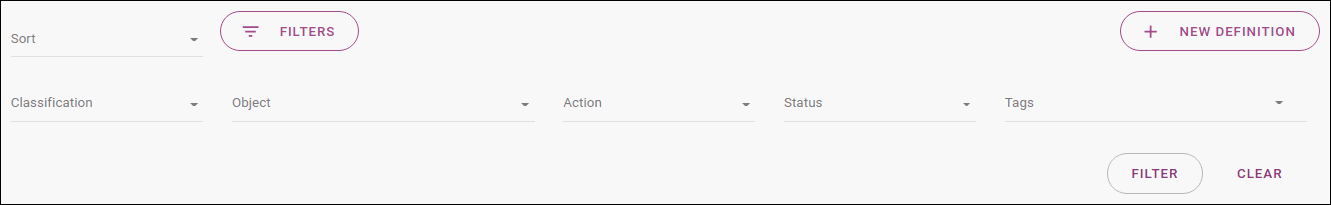
Filter fields to easily find alerts
Alert information
Triggered alerts are displayed in cards that show the notification type, an icon representing its classification, the time the alert was triggered, and the message sent.
NOTEThe times when alerts were triggered follow your user's preferred time zone. If you change your preferred time zone, the alert trigger times will be updated to reflect the new zone. The same applies to alert notification messages when they include times (such as when a Platform object was modified).
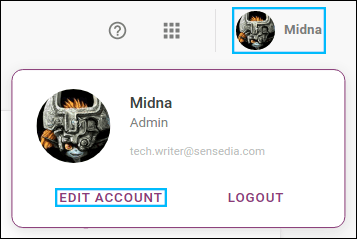
You can change your preferred time zone by clicking your avatar in the upper right corner of any screen and then EDIT ACCOUNT:
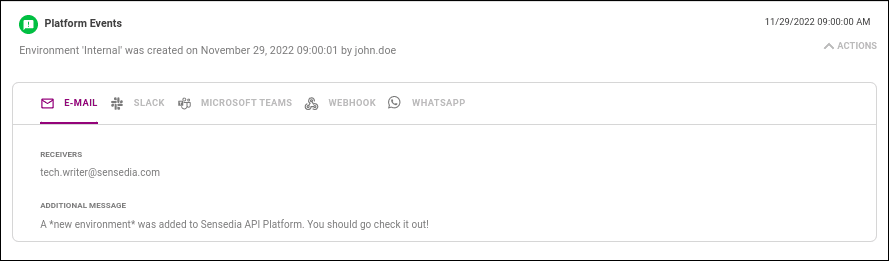
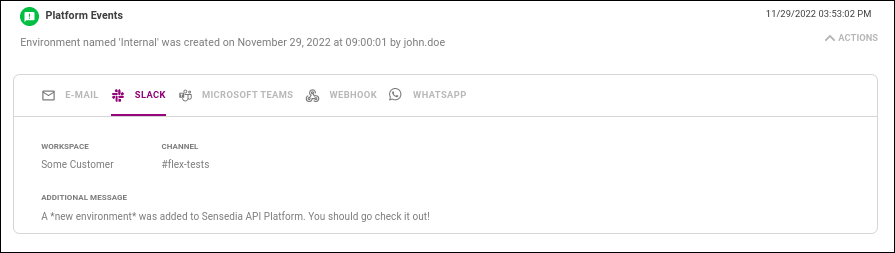
By clicking the ACTIONS button on a card, you can view the actions taken after an alert was triggered:
- The E-MAIL tab displays the recipients who received email notifications, if this type of action was configured (RECEIVERS field). If a custom message was added, it will appear in the ADDITIONAL MESSAGE field.
NOTEReceivers must accept to receive notifications by clicking a confirmation link sent by email. If there is no confirmed receiver for the notification, the E-MAIL tab will not contain email addresses.
- The SLACK tab displays the workspace and channel configured to receive notifications. If a custom message was added, it will appear in the ADDITIONAL MESSAGE field.
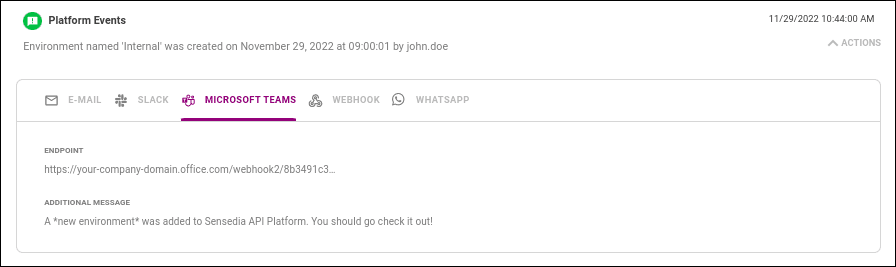
- The MICROSOFT TEAMS tab displays the registered endpoint for sending notification requests, if this type of action was configured. If a custom message was added, it will appear in the ADDITIONAL MESSAGE field.
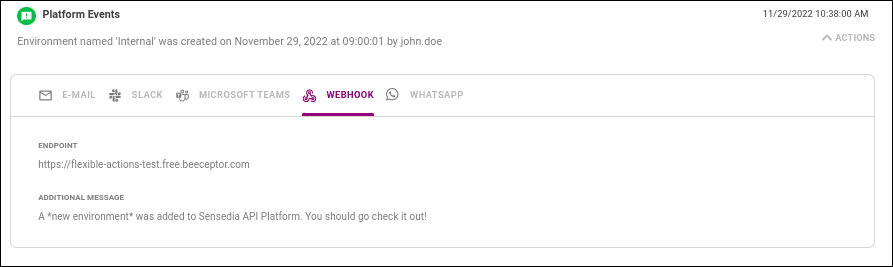
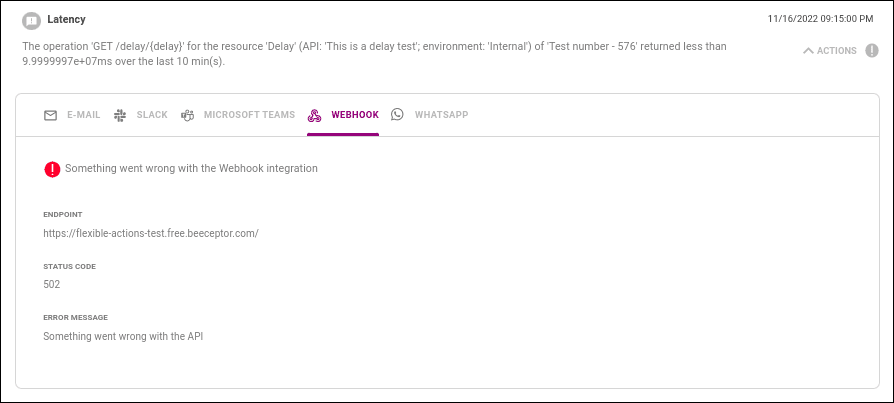
- The WEBHOOK tab displays the registered endpoint for sending notification requests, if this type of action was configured. If a custom message was added, it will appear in the ADDITIONAL MESSAGE field.
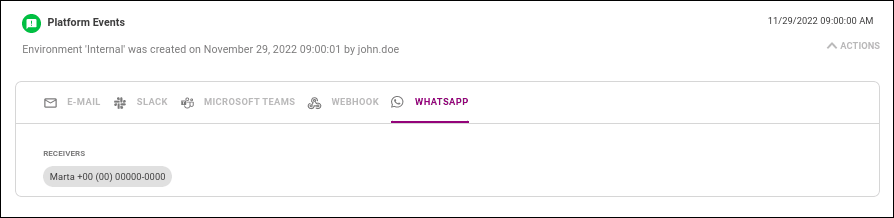
- The WHATSAPP tab displays the phone numbers that received notifications via WhatsApp, if this type of action was configured (RECEIVERS field).
If the ACTIONS button is accompanied by the ![]() icon, it means there was an error executing one or more configured actions.
By clicking the button to open the actions, you can see error details.
In the example below, it was not possible to access the registered endpoint for sending the request via the Webhook action:
icon, it means there was an error executing one or more configured actions.
By clicking the button to open the actions, you can see error details.
In the example below, it was not possible to access the registered endpoint for sending the request via the Webhook action:
You can filter alerts based on failed actions using the Action Status field in the search area (after clicking the FILTERS button).